Saturday 30 June 2018

Python - Some month end observations...

Final Thoughts

I have thoroughly enjoyed programming in Python this month. I have been surprised by the huge ecosystem of free packages that is available. Any VBA developer who is frustrated not to find a helpful COM library for a particular task should definitely investigate the Python ecosystem as chances are someone has already written it.

I didn't complete everything I wanted. I will continue to work through the agenda in my head. In fact Python will now definitely feature on this blog regularly alongside VBA, Javascript and others.

Miscellany

A miscellany of thoughts not substantial enough to warrant their own blog posts

VBA Programmers should stop Shelling and use the Gateway Class design pattern instead

Perusing StackOverflow it seems very many devs are using Shell to run Python when they could be using the Gateway class design pattern, plnety of examples on this blog this month.

VBA Programmers should stop using Python with the Script Control and use the Gateway Class design pattern instead

I have used the ScriptControl for Javascript and have had some success calling Javascript features from VBA (such as parsing JSON). So I know ScriptControl is not good for debugging. I'd use Visual Studio to debug and I'd use a Gateway class to invoke the exact same script file instead of having to adjust the Python code for injection into ScriptControl. Besides I think money is required to run Python on the ScriptControl in production. Whereas the gateway class approach is free.

Python is a script but it is compiled

One can see __pychache__ directories containing *.pyc files which may not be machine code but are in fact byte code. This is reassuring and ought to aid performance for a script technology.

Python has a virtual machine

According to this SO answer

Python Bootcamps

Just some links to some Python bootcamp listings

Python - Excel - Call Python from worksheet using reflection

Today is final day of Python month on this Excel Development Platform blog where I highlight some Python technologies of interest to Excel (VBA) Developers.

Here I show how one can call Python functions from a worksheet. It requires a VBA pass through function but don't worry we can very easily use reflection to very easily automatically generate the VBA pass through functions.

Python Calculator with Reflection

So I have shown the pattern in the code below many times this month where I define a class and register the COM class so it is creatable and callable from VBA. It is a requirement to maintain a list of public methods for the COM interop to work. We can use this list to filter reflection artefacts.

In the code below pythonSum and pythonMultiply are just example methods which we will call from the worksheet. They are named distinctly to help distinguish from other worksheet functions; you can choose your own naming convention.

What's new in the code below is the reflect method. This method uses Python's inspect module. First, we call inspect.gemembers() but we have to filter these results firstly against our list of _public_methods_ and also to filter out the reflect method itself; this yields a collection of two methods pythonSum and pythonMultiply. Then for both of these methods we call inspect.getargspec() but from the results we remove the leading self argument and keep the remaining arguments.

The method name and argument lists are then packed into a Scripting.Dictionary for consumption in VBA.

class PythonCalculator(object):
    _reg_clsid_ = "{38C05F9C-5FEA-40A3-83B3-FD0E102E97B7}"
    _reg_progid_= 'PythonInVBA.PythonCalculator'
    _public_methods_ = ['pythonMultiply','pythonSum','reflect']

    def reflect(self):
        import inspect 
        import win32com.client
        msDict = win32com.client.Dispatch("Scripting.Dictionary")
        
        for inspectMethodLoop in inspect.getmembers(self):
            if inspectMethodLoop[0] in PythonCalculator._public_methods_:
                if inspectMethodLoop[0]!='reflect':
                    msDict.add(inspectMethodLoop[0],str(inspect.getargspec(inspectMethodLoop[1]).args[1:]))

        return msDict 

    def pythonSum(self,x,y):
        return x+y

    def pythonMultiply(self,a,b):
        return a*b

if __name__=='__main__':
    print ("Registering COM server...")
    import win32com.server.register
    win32com.server.register.UseCommandLine(PythonCalculator)

VBA Code to Auto-generate Pass-Through Worksheet Functions

So on the VBA side we write the following code which calls the reflect method and then processes the results in the Scripting.Dictionary and automatically generates VBA source code for the pass through functions which are then callable from a worksheet. Here is the VBA code...

Sub Test4()
    On Error GoTo ErrHand:

    Dim obj As Object
    Set obj = VBA.CreateObject("PythonInVBA.PythonCalculator")
    
    Dim dictReflect As Object
    Set dictReflect = obj.reflect()
    
    Debug.Print Reflect2("PythonInVBA.PythonCalculator", dictReflect)
    
SingleExit:
    Exit Sub

ErrHand:
    Debug.Print Err.Description
    GoTo SingleExit
End Sub


Function Reflect2(ByVal sClassName As String, ByVal dictReflect As Object)
    Dim sVBACode As String
    
    Dim vKeyLoop As Variant
    For Each vKeyLoop In dictReflect
        Dim sArgsInRoundBrackets As String
        sArgsInRoundBrackets = VBA.Replace(VBA.Replace(VBA.Replace(dictReflect(vKeyLoop), "'", ""), "[", "("), "]", ")")
        Dim sFunc As String
        sFunc = "Function " & vKeyLoop & sArgsInRoundBrackets & vbNewLine
        
        sFunc = sFunc & vbTab & vKeyLoop & " = VBA.CreateObject(""" & sClassName & """)." & vKeyLoop & sArgsInRoundBrackets & vbNewLine
        
        sFunc = sFunc & "End Function" & vbNewLine & vbNewLine
        sVBACode = sVBACode & sFunc
    Next

    Reflect2 = sVBACode
End Function

The output of the above code is some more VBA code sitting in the Immediate window which you should then copy and paste into your source. Here is the output.

Function pythonMultiply(a, b)
    pythonMultiply = VBA.CreateObject("PythonInVBA.PythonCalculator").pythonMultiply(a, b)
End Function

Function pythonSum(x, y)
    pythonSum = VBA.CreateObject("PythonInVBA.PythonCalculator").pythonSum(x, y)
End Function

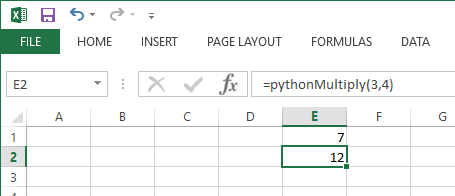
After pasting the pass through functions into your source the functions are now callable from the worksheet. As proof that this works here is a little screenshot of a worksheet showing the pythonMultiply() function being called.

Final Thoughts

I have seen some Python packages that go to great lengths to make Python callable from the worksheet but this is unnecessary. A trivial amount of VBA that can be very easily generated with reflection gets you there. This took less than an hour to figure out.

Friday 29 June 2018

Python - Pandas - ADO - Convert a Pandas DataFrame to an ADO Recordset

So it's Python month on this Excel Development Platform blog where I highlight some Python technologies of interest to Excel (VBA) Developers.

So Python has the Pandas data processing library and one could move logic from VBA into a Python middle tier application server but sometimes you may still want some data processing functionality to remain in the VBA layer. Can a Pandas DataFrame be converted to an ADO Recordset? Yes, but you'll need to convert it into an Xml representation first and then pass the string to VBA where it recreates the ADO recordset.

Python code to convert Pandas dataframe to Xml representation of an ADO Recordset

Much of the Xml representation of an ADO recordset is boilerplate code, however in the first section one can see the column names of Col1,Col2,Col3. Then in the z:row elements the field values are added as attributes and the attribute names must match the column names Col1,Col2,Col3. Then add a tail and return the whole string to VBA.

import pandas as pd
import numpy as np

class PopulationDensity(object):
    _reg_clsid_ = "{C50910CC-F88F-4EA5-86D4-1E5D6AF1F4AE}"
    _reg_progid_= 'PandasInVBA.PopulationDensity'
    _public_methods_ = ['getPivotTable','getADORecordset']

    def getADORecordset(self):
        url="https://raw.githubusercontent.com/datasets/house-prices-uk/master/data/data.csv"
        whole=pd.read_csv(url)

        ## project first three columns
        projected = whole[['Date','Price (All)','Change (All)']]

        ## So now start creating the Xml representation of an ADO Recordset
        sStart = ("<xml xmlns:x='urn:schemas-microsoft-com:office:excel' "  +
        "    xmlns:dt='uuid:C2F41010-65B3-11d1-A29F-00AA00C14882' "  +
        "    xmlns:s='uuid:BDC6E3F0-6DA3-11d1-A2A3-00AA00C14882' "  +
        "    xmlns:rs='urn:schemas-microsoft-com:rowset' "  +
        "    xmlns:z='#RowsetSchema'>"  +
        "<x:PivotCache>"  +
        "<x:CacheIndex>1</x:CacheIndex>"  +
        "<s:Schema id='RowsetSchema'>"  +
        "<s:ElementType name='row' content='eltOnly'>"  +
        "<s:attribute type='Col1'/>"  +
        "<s:attribute type='Col2'/>"  +
        "<s:attribute type='Col3'/>"  +
        "<s:extends type='rs:rowbase'/>"  +
        "</s:ElementType>"  +
        "<s:AttributeType name='Col1' rs:name='Date'>"  +
        "<s:datatype dt:maxLength='255'/>"  +
        "</s:AttributeType>"  +
        "<s:AttributeType name='Col2' rs:name='Price (All)'>"  +
        "<s:datatype dt:maxLength='255'/>"  +
        "</s:AttributeType>"  +
        "<s:AttributeType name='Col3' rs:name='Change (All)'>"  +
        "<s:datatype dt:maxLength='255'/>"  +
        "</s:AttributeType>"  +
        "</s:Schema>"  +
        "<rs:data>" )

        ## now the data section, we iterate over the rows of the pandas DataFrame
        sData =""
        for index, row in projected.iterrows():
            sData = sData + "<z:row Col1='" + str(row['Date']) + "' Col2='" + str(row['Price (All)']) + "' Col3='" + str(row['Change (All)']) + "'/>"

        sEnd = (
        "</rs:data>"  +
        "</x:PivotCache>"  +
        "</xml>"  )

        return sStart + sData + sEnd 

    def getPivotTable(self):
        pass  # see previous article

if __name__=='__main__':
    print ("Registering COM server...")
    import win32com.server.register
    win32com.server.register.UseCommandLine(PopulationDensity)

Client VBA Code

So here is the VBA code. An Xml Dom document is created, and the string returned from Python is parsed as a document. Then an ADO recordset is created and we call Open passing the DomDocument as the argument. This technique leverages the fact that recordsets can be persisted to xml files.

Sub Test2()

    Dim obj As Object
    Set obj = VBA.CreateObject("PandasInVBA.PopulationDensity")
    
    Dim sDataAsXml As String
    sDataAsXml = obj.getADORecordset
    
    '* Tools->References:Microsoft Xml, v6.0
    Dim domXlPersist As MSXML2.DOMDocument60
    Set domXlPersist = New MSXML2.DOMDocument60
    domXlPersist.LoadXML sDataAsXml
    Debug.Assert domXlPersist.parseError.ErrorCode = 0
    
    '* Tools->References:Microsoft ActiveX Data Object 6.1 Library
    Dim rs As ADODB.Recordset
    Set rs = New ADODB.Recordset
    rs.Open domXlPersist
    

    Dim rngOrigin As Excel.Range
    Set rngOrigin = Sheet3.Cells(12, 1)
    
    '* write column headers
    Dim lFieldLoop As Long
    For lFieldLoop = 0 To rs.Fields.Count - 1
        rngOrigin.Offset(0, lFieldLoop).Value = rs.Fields.Item(lFieldLoop).Name
    Next lFieldLoop
    
    '* write the data, yes, in one line
    rngOrigin.Offset(1, 0).CopyFromRecordset rs

End Sub

Final Thoughts

In the code given I have serialized a Dataframe to a (potentially large) Xml string then on the client side parsed it into a Dom and then an ADO recordset. This is quite a heavy set of operations. If you are calling an in process component then it would be better to pass it back as an OLE Variant. However, the above technique maybe better suited for Flask web services where conversion to strings is standard practice as part of the HTTP protocol.

Python - Pandas - VBA - Return a Pandas Pivot Table to VBA (using COM)

So it's Python month on this Excel Development Platform blog where I highlight some Python technologies of interest to Excel (VBA) Developers.

A few days prior I blogged a post about using Pandas to process some very large Eurostat Population Density data set, once I got the Pandas pivot table I saved it to a csv file which is unsatisfactory; the truth is I was having difficulty returning the Pandas pivot table to VBA as a 2d OLE Variant that can be pasted onto a worksheet. In this post I fix that.

Python code to return an OLE Variant from a Pandas Pivot

First the Python code. So the upper half of this code is the same as in the previous pandas article. So this task involves extracting portions of the pivot table, converting them to numpy arrays and then glueing them into one large 2d array.

import pandas as pd
import numpy as np

class PopulationDensity(object):
    #"{C50910CC-F88F-4EA5-86D4-1E5D6AF1F4AE}"
    _reg_clsid_ = "{C50910CC-F88F-4EA5-86D4-1E5D6AF1F4AE}"
    _reg_progid_= 'PandasInVBA.PopulationDensity'
    _public_methods_ = ['getPivotTable']

    def getPivotTable(self):
        ## csv file in zip http://ec.europa.eu/eurostat/cache/GISCO/geodatafiles/GEOSTAT-grid-POP-1K-2011-V2-0-1.zip

        url="C:/Users/Simon/Downloads/GEOSTAT-grid-POP-1K-2011-V2-0-1/Version 2_0_1/GEOSTAT_grid_POP_1K_2011_V2_0_1.csv"
        whole=pd.read_csv(url, low_memory=False)

        ## only want two columns
        populationDensity=whole[['TOT_P','CNTR_CODE']]

        ## trying to replicate graph here http://www.centreforcities.org/wp-content/uploads/2018/04/18-04-16-Square-kilometre-units-of-land-by-population.png
        ## which aggregates the records by brackets

        # https://stackoverflow.com/questions/25010215/pandas-groupby-how-to-compute-counts-in-ranges#answer-25010952
        # also relevant https://stackoverflow.com/questions/21441259/pandas-groupby-range-of-values#answer-21441621
        ranges = [0,10000,15000,20000,25000,30000,35000,40000,45000,1000000]

        ## Yes groupby but we want to work with a DataFrame afterwards
        # https://stackoverflow.com/questions/10373660/converting-a-pandas-groupby-object-to-dataframe
        groupedByBracketandCountry = populationDensity.groupby(['CNTR_CODE',pd.cut(populationDensity['TOT_P'],ranges).astype(str)]).size().to_frame(name = 'count').reset_index()

        # https://pandas.pydata.org/pandas-docs/stable/generated/pandas.DataFrame.pivot_table.html#pandas.DataFrame.pivot_table
        pivottable2=pd.pivot_table(groupedByBracketandCountry, fill_value=0, values='count', index='TOT_P',columns=['CNTR_CODE'] , aggfunc=np.sum)

        # new code here that extracts portions of pivot table into arrays and then glues then together into one returnable array

        pivottable2Values = pivottable2.values             # this gives the data elements of the pivot table
        pivottable2Columns = pivottable2.columns.values    # this gives the column headers of the pivot table

        # the next line glues one 2d array on top of another (i.e. vertically)
        pivottable2ColumnsAndValues = np.vstack((pivottable2Columns,pivottable2Values))

        # this will be our origin cell, in the top left
        pythontopLeft=np.zeros((1,1))

        # this gets our rows headers in a 2d array, np.reshape upgrades the 1d array to 2d
        indexValues =  np.reshape(pivottable2.index.values, (-1, 1))

        # this next line glues one 2d array on top of another (i.e. vertically)
        pivottable2Index = np.vstack((pythontopLeft,indexValues))

        # this next line glues one 2d array onto the side of another (i.e. horizontally)
        vRet = np.hstack((pivottable2Index,pivottable2ColumnsAndValues))

        # this final line helps the conversion to an OLE Variant pastable onto an Excel worksheet
        return vRet.tolist()

if __name__=='__main__':
    print ("Registering COM server...")
    import win32com.server.register
    win32com.server.register.UseCommandLine(PopulationDensity)

np.vstack, np.hstack and np.reshape

There are some interesting numpy array functions introduced here np.vstack, np.hstack and np.reshape; the first two glue two array either vertically or horizontally; np.reshape can be used to redimension an array.

Without tolist() you get this error

The final requirement to pass back a numpy array to Excel VBA is to use tolist() because numpy array are not convertible to an OLE Variant but lists are. If you forget to add to tolist() then you get the following error.

Unexpected Python Error: ValueError: ndarray is not C-contiguous

VBA Client Code

So now the VBA is quite simple. The Python returns an OLE Variant array of two dimensions, we calculate the dimensions and then paste onto the sheet.

Sub Test()

    Dim obj As Object
    Set obj = VBA.CreateObject("PandasInVBA.PopulationDensity")
    
    Dim v
    v = obj.getPivotTable
    
    Dim lRows As Long
    lRows = UBound(v, 1) - LBound(v, 1)
    
    Dim lColumns As Long
    lColumns = UBound(v, 2) - LBound(v, 2)
    
    Dim rng As Excel.Range
    Set rng = Sheet3.Range(Sheet3.Cells(1, 1), Sheet3.Cells(lRows, lColumns))
    rng.Value = v
End Sub

Python - Excel - Scripting Excel Objects and Files

So it's Python month on this Excel Development Platform blog where I showcase interesting Python technologies that might be of interest to Excel (VBA) Developers. Python does COM interop so it can script against the Excel Object Model. So what are the options?

Python to replace VBA?

Your first option could be to wait because VBA is old. VBA is as dated as Visual Basic 6.0 (they are essentially the same language). At some point VBA will be replaced. We do not know if VBA will be replaced with C# or VB.NET. YCombinator reports Excel team considering Python as scripting language, asking for feedback. Here is the feedback forum.

If Microsoft does replace VBA with Python I should imagine Microsoft would do a pretty good job of it.

Python COM Interop and Excel, win32com

So VBA scripts against the Excel object model. In fact the Excel object model is exported and exposed to any COM enabled language. Python has COM interop packages and is thus COM enabled. The key package is win32com. Below is some sample code which should be easy to follow for VBA programmers familiar with the Excel object model. The code is taken from Tim Golden's excellent website. Tim Golden has all sorts of excellent Python for windows tips here. I'd like to particularly highlight folder watching which I could use as part of a message queue solution. They leverage the pywin32 library written by Mark Hammond (twitter github ), another superb technologist!

import os, sys  #Written by Tim Golden
import csv
import tempfile
import win32com.client

#
# Cheating slightly because I know a .csv
# file will register as an Excel object
#

filename = tempfile.mktemp (".csv")
f = open (filename, "wb")
writer = csv.writer (f)
writer.writerows (range (i, i+5) for i in range (10))
f.close ()

#
# NB filename must (in effect) be absolute
#
os.startfile (filename)

wb1 = win32com.client.GetObject (filename)
wb1_c11 = wb1.ActiveSheet.Cells (1, 1)
print wb1_c11.Value
wb1_c11.Value += 1

xl = win32com.client.GetObject (Class="Excel.Application")
# could also use:
# xl = win32com.client.GetActiveObject ("Excel.Application")
xl_c11 = xl.ActiveSheet.Cells (1, 1)
print xl_c11.Value
xl_c11.Value += 1

print wb1_c11.Value
print xl_c11.Value

wb1.Close ()

os.remove (filename)

Python Packages Without Excel.exe

The following packages do not need a running copy of Excel. The authors have very kindly wrestled with the Excel file format specifications and put together code which can either create, read or manipulate Excel files without needing to run a copy of Excel. Economical for Excel licences and also ensures code can run on Linux (where Excel.exe cannot run) for further cost savings.

openpyxl

The documentation states

Openpyxl is a Python library for reading and writing Excel 2010 xlsx/xlsm/xltx/xltm files. It was born from lack of existing library to read/write natively from Python the Office Open XML format.

So this refers the face that Office 2010 introduced new file type options, xlsx and xlsm which are Xml based (and then zipped). To be fair the Xml formats are hard to follow and they have done us a great favour in writing this library. Here is some sample code to get a flavour.

from openpyxl import Workbook
wb = Workbook()

# grab the active worksheet
ws = wb.active

# Data can be assigned directly to cells
ws['A1'] = 42

# Rows can also be appended
ws.append([1, 2, 3])

# Python types will automatically be converted
import datetime
ws['A2'] = datetime.datetime.now()

# Save the file
wb.save("sample.xlsx")

xlsxwriter

Another package written for xlsx (Xml) file types this time written by Jon McNamara (github, twitter). John McNamara is also on cpan.org where has prolifically written many packages in different languages including Lua, Python, Ruby, C and Perl. Here is some sample code.

##############################################################################
#
# A simple example of some of the features of the XlsxWriter Python module.
#
# Copyright 2013-2018, John McNamara, jmcnamara@cpan.org
#
import xlsxwriter


# Create an new Excel file and add a worksheet.
workbook = xlsxwriter.Workbook('demo.xlsx')
worksheet = workbook.add_worksheet()

# Widen the first column to make the text clearer.
worksheet.set_column('A:A', 20)

# Add a bold format to use to highlight cells.
bold = workbook.add_format({'bold': True})

# Write some simple text.
worksheet.write('A1', 'Hello')

# Text with formatting.
worksheet.write('A2', 'World', bold)

# Write some numbers, with row/column notation.
worksheet.write(2, 0, 123)
worksheet.write(3, 0, 123.456)

# Insert an image.
worksheet.insert_image('B5', 'logo.png')

workbook.close()

xlrd

The documentation says

xlrd is a library for reading data and formatting information from Excel files, whether they are .xls or .xlsx files.

So this package can read older formats as well as the newer .xlsx .xlsm (Xml) formats.

xlutils

The documentation describes this as

This package provides a collection of utilities for working with Excel files.

Without delving through all of the documentation I think this library is more file stream based, a bit like SAX for Xml. Here is some sample code defining a filter that allows even rows through but odd rows not ...

>>> from xlutils.filter import BaseFilter
>>> class EvenFilter(BaseFilter):
...
...     def row(self,rdrowx,wtrowx):
...         if not rdrowx%2:
...             self.next.row(rdrowx,wtrowx)
...
...     def cell(self,rdrowx,rdcolx,wtrowx,wtcolx):
...         if not rdrowx%2:
...             self.next.cell(rdrowx,rdcolx,wtrowx,wtcolx)

And here is run through using the filter give above...

>>> from xlutils.filter import process
>>> process(
...     MyReader('test.xls'),
...     MyFilter('before'),
...     EvenFilter(),
...     MyFilter('after'),
...     MyWriter()
...     )
before start
after start
before workbook  test.xls
after workbook  test.xls
before sheet  Sheet1
after sheet  Sheet1
before row 0 0
after row 0 0
before cell 0 0 0 0
after cell 0 0 0 0
before cell 0 1 0 1
after cell 0 1 0 1
before row 1 1
before cell 1 0 1 0
before cell 1 1 1 1
before sheet  Sheet2
after sheet  Sheet2
before row 0 0
after row 0 0
before cell 0 0 0 0
after cell 0 0 0 0
before cell 0 1 0 1
after cell 0 1 0 1
before row 1 1
before cell 1 0 1 0
before cell 1 1 1 1
before finish
after finish
Wednesday 27 June 2018

Python - Web - Visual Studio 2017 - Project Templates Surveyed

So this is Python month on this blog where I review Python technologies that might be of interest to Excel (VBA) developers. Web services are a way of exporting functionality to a wide range of clients including Excel VBA. So on the client side, VBA can call web services using the MSXML2.XMLHTTPRequest (XHR) class. On the server side can be any technology so long as it supports HTTP protocols.

VS2017 Python Web Project Templates Surveyed

In this post I look at the Visual Studio 2017 project templates catagorized as 'Python - Web' to see which is best for building a web service consumable from Excel VBA.

VS2017 Python Web Project Templates' Summaries

In Visual Studio 2017 when one select a new Project on has the following choices, selecting each one in turn one an read the template summary, I have deposited them here ...

Azure Cloud Service A project for creating a scalable service that runs on Microsoft Azure
Web Project A project for creating a generic Python web project
Bottle Web Project A project for creating an application using the Bottle web framework. It features sample pages that use the Twitter Bootstrap framework for responsive web design.
Django Web project A project for creating an application using the Django web framework. It features sample pages that use the Twitter Bootstrap framework for responsive web design.
Flask Web Project A project for creating an application using the Flask web framework with the Jinja template engine. It features sample pages that use the Twitter Bootstrap framework for responsive web design.
Flask/Jade Web Project A project for creating an application using the Flask web framework with the Jade template engine. It features sample pages that use the Twitter Bootstrap framework for responsive web design.
Blank Bottle Web Project A project for creating a Bottle web project.
Blank Django Web Project A project for creating a Django project.
Blank Flask Web Project A project for creating a Flask web project.
Polls Bottle Web Project A sample polls application using the Bottle web framework. It can be configured to use Azure Table Storage or MongoDB for storage.
Polls Django Web Project A sample polls application using the Django web framework.
Polls Flask Web Project A sample polls application using the Flask web framework. It can be configured to use Azure Table Storage or MongoDB for storage.
Polls Flask/Jade Web Project A sample polls application using the Flask web framework with the Jade template engine. It can be configured to use Azure Table Storage or MongoDB for storage.

VS2017 Python Web Project Templates' Feature Grid

It is probably better to see the difference between the templates with a feature grid ...

Blank Sample App (Polls) Framework Template Engine Bootstrap samples Azure Table Storage/MongoDB storage
Web Project
Bottle Web Project Bottle x
Django Web project Django x
Flask Web Project Flask Jinja x
Flask/Jade Web Project Flask Jade x
Blank Bottle Web Project x Bottle
Blank Django Web Project x Django
Blank Flask Web Project x Flask
Polls Bottle Web Project x Bottle x
Polls Django Web Project x Django x
Polls Flask Web Project x Flask x
Polls Flask/Jade Web Project x Flask Jade x

VS2017 Python Web Project Templates Glossary

And we ought to provide a glossary and links for some of those terms ....

BottleWikipedia: Bottle is a WSGI micro web-framework for the Python programming language.
DjangoWikipedia: Django is a free and open-source web framework, written in Python, which follows the model-view-template (MVT) architectural pattern
FlaskWikipedia: Flask is a micro web framework written in Python. It is classified as a microframework because it does not require particular tools or libraries.
JinjaWikipedia: Jinja is a template engine for the Python programming language and is licensed under a BSD License created by Armin Ronacher.
JadeRenamed Pug. Jade/Pug is an HTML template engine
BootstrapWikipedia: Bootstrap is a free and open-source front-end framework (library) for designing websites and web applications.
Azure Table StorageMicrosoft: A NoSQL key-value store for rapid development using massive semi-structured datasets.
MongoDB storageWikipedia: MongoDB is a free and open-source cross-platform document-oriented database program.
WSGIWikipedia: The Web Server Gateway Interface (WSGI) is a simple calling convention for web servers to forward requests to web applications or frameworks written in the Python programming language.

So Django is for a fully fledged web front end. Both Flask and Bottle are "microframeworks" which are lightweight compared to Django. Flask and Bottle seem quite similarly pitched, so which to choose? Well (at the time of writing) Flask has 22,409 StackOverflow questions and Bottle only has 1249 StackOverflow questions, making one metric in favour of Flask. One can review the battle of these frameworks with Google.

Blank Flask Web Project Web Service

So to see what one gets out of the box, selecting Blank Flask Web Project does some installs and gets a source file app.py which looks like this...

"""
This script runs the application using a development server.
It contains the definition of routes and views for the application.
"""

from flask import Flask
app = Flask(__name__)

# Make the WSGI interface available at the top level so wfastcgi can get it.
wsgi_app = app.wsgi_app


@app.route('/')
def hello():
    """Renders a sample page."""
    return "Hello World!"

if __name__ == '__main__':
    import os
    HOST = os.environ.get('SERVER_HOST', 'localhost')
    try:
        PORT= 51382 #PORT = int(os.environ.get('SERVER_PORT', '5555'))
    except ValueError:
        PORT = 5555
    app.run(HOST, PORT)

Note, i have fixed the port number to be 51382. Running the project runs the Flask app in a development server ...

 * Serving Flask app "app" (lazy loading)
 * Environment: production
   WARNING: Do not use the development server in a production environment.
   Use a production WSGI server instead.
 * Debug mode: off
 * Running on http://localhost:51382/ (Press CTRL+C to quit)
127.0.0.1 - - [27/Jun/2018 18:21:14] "GET / HTTP/1.1" 200 -
127.0.0.1 - - [27/Jun/2018 18:21:14] "GET /favicon.ico HTTP/1.1" 404 -

and a new browser windows is spawned and navigates to the app's web address. The app is also callable from Excel VBA...

Sub TestCallFlask()
    '* Tools->References->Microsoft XML, v6.0
    Dim oXHR As MSXML2.XMLHTTP60
    Set oXHR = New MSXML2.XMLHTTP60
    
    oXHR.Open "GET", "http://localhost:51382/", False
    oXHR.send
    
    Debug.Print oXHR.responseText 'Prints Hello World!

End Sub

Links

Final Thoughts

Earlier examples in Python month show VBA<-->Python interop via a COM class but some return types (such as pandas' DataFrame) don't easily convert to something returnable through these classes (they often have to be convertible to a SAFEARRAY). Shipping your app as a web service can help bridge interop difficulties so web services are a valuable option.

Tuesday 26 June 2018

Python - Pandas - Data Processing

Introduction

So its Python month on this blog where I'm highlighting Python libraries of interest to Excel programmers.

Python's pandas library rivals not only Excel worksheet data processing function but also SQL and even C#'s LINQ.

Installing pandas

Install from a command windows with admin rights...

pip install pandas
...
Installing collected packages: six, python-dateutil, numpy, pandas
Successfully installed numpy-1.14.5 pandas-0.23.1 python-dateutil-2.7.3 six-1.11.0

So install went very well. Of interest is the library called six which helps code span the Python2 vs Python3 divide; whilst https://pypi.org/project/numpy/ gives array processing.

Simple CSV Data Set - UK House Prices

Found a smallish data set of UK House prices and will use that to begin playing with pandas.

Rows and Columns of data set

I am reminded of VBA two dimensional arrays when working with pandas data sets and when programming one needs to get the rows and columns. Here I give code to show rows and columns. Also this exemplifies sub-selecting (projecting) the first three columns

import pandas as pd

url="https://raw.githubusercontent.com/datasets/house-prices-uk/master/data/data.csv"
whole=pd.read_csv(url)

## drill into shapes tuple to get rows
print(str(whole.shape[0]) + " rows")

## project first three columns
projected = whole[['Date','Price (All)','Change (All)']]
## drill into shapes tuple to get columns
print(str(projected.shape[1]) + " columns")

print (projected.shape) ## outputs (261, 3) 

print(projected.index)  ## outputs RangeIndex(start=0, stop=261, step=1)

print(projected)        ## outputs top and bottom of table

The final print statement outputs the following...

#           Date  Price (All)  Change (All)
#0    1952-11-01         1891           0.0
#1    1953-02-01         1891           0.0
#2    1953-05-01         1891           0.0
#3    1953-08-01         1881           0.0
#4    1953-11-01         1872          -1.0
#5    1954-02-01         1863          -1.5
#..          ...          ...           ...
#256  2016-11-01       205937           4.5
#257  2017-02-01       206665           4.1
#258  2017-05-01       209971           2.8
#259  2017-08-01       211672           2.6
#260  2017-11-01       211433           2.7

Big Data Set - European Population Density Grid

So the maximum number of rows for an Excel worksheet is 1,048,576 rows (2^20) and I have found a data set with double that. The EU statistics agency, EuroStat, divides Europe into a series of grids and counts the people living in the grid; this data set is known as the GEOSTAT 2011 population grid, here is the download page which hosts the zip file. Within the zip is csv file, Version 2_0_1\GEOSTAT_grid_POP_1K_2011_V2_0_1.csv.

I came across this data thanks to a housing report published by think tank UkOnward written by Neil O'Brien and it referenced an article from Centre For Cities. They have processed the data nicely to illustrate how different EU member states have different dispersions of population densities; I'd interpret this as saying some countries do high rise residential blocks better than others. Here is their nice graphic.

But I wanted the underlying data, so I wrote a Python program that does the number crunching and here is a portion of the edited csv file which looks like it agrees with the graph once you ignore the 0-10000 bracket which isn't on the graphic.

TOT_P BE DE ES FR IT NL UK
(0, 10000] 25399 214363 62516 372112 171736 30550 127750
(10000, 15000] 29 211 455 234 343 51 223
(15000, 20000] 23 51 241 73 93 17 49
(20000, 25000] 3 8 132 32 36 4
(25000, 30000] 2 87 14 5
(30000, 35000] 45 21 3
(35000, 40000] 23 9
(40000, 45000] 13 7
(45000, 1000000] 10 3

And here is the source code


import pandas as pd
import numpy as np

## csv file in zip http://ec.europa.eu/eurostat/cache/GISCO/geodatafiles/GEOSTAT-grid-POP-1K-2011-V2-0-1.zip

url="C:/Users/Simon/Downloads/GEOSTAT-grid-POP-1K-2011-V2-0-1/Version 2_0_1/GEOSTAT_grid_POP_1K_2011_V2_0_1.csv"
whole=pd.read_csv(url, low_memory=False)

## only want two columns
populationDensity=whole[['TOT_P','CNTR_CODE']]

## trying to replicate graph here http://www.centreforcities.org/wp-content/uploads/2018/04/18-04-16-Square-kilometre-units-of-land-by-population.png
## which aggregates the records by brackets

# https://stackoverflow.com/questions/25010215/pandas-groupby-how-to-compute-counts-in-ranges#answer-25010952
# also relevant https://stackoverflow.com/questions/21441259/pandas-groupby-range-of-values#answer-21441621
ranges = [0,10000,15000,20000,25000,30000,35000,40000,45000,1000000]

## Yes groupby but we want to work with a DataFrame afterwards
# https://stackoverflow.com/questions/10373660/converting-a-pandas-groupby-object-to-dataframe
groupedByBracketandCountry = populationDensity.groupby(['CNTR_CODE',pd.cut(populationDensity['TOT_P'],ranges)]).size().to_frame(name = 'count').reset_index()

#print (groupedByBracketandCountry) ## outputs the new DataFrame with the brackets

# https://pandas.pydata.org/pandas-docs/stable/generated/pandas.DataFrame.pivot_table.html#pandas.DataFrame.pivot_table
pivottable2=pd.pivot_table(groupedByBracketandCountry, values='count', index='TOT_P',columns=['CNTR_CODE'] , aggfunc=np.sum)
#print (pivottable2)

pivottable2.to_csv("C:/Users/Simon/Downloads/GEOSTAT-grid-POP-1K-2011-V2-0-1/Version 2_0_1/CountPivot.csv")

Pandas is a massive library and I need to go off and read the documentation. A pandas DataFrame is akin to an ADO Recordset familiar to VBA programmers. I used some groupby functionality without using SQL. Also the above program uses a pivot table in code without needing to locate a table on a worksheet like Excel does. Pandas looks extremely useful.

Monday 25 June 2018

Python - SVG - Extract and Parse Path Data from d attribute

Introduction

SVG draw shapes using a path language with commands such as moveto x1,y1; lineto x2,y2; lineto x3,y3; lineto x4,y4 then closepath. All of this is packed into a SVG Path element's d attribute. Python has a library, svg.path to parse these commands.

Background

Ok, so previous post I gave VBA code to extract some shapes from a SVG file converted from a PDF file (in the name of extracting the underlying data point) but whilst VBA has an Xml library it does not have a library to parse the d attribute. So we'll switch into Python. Besides, its Python month on this blog and so I'm meant to be reviewing and introducing useful and interesting Python libraries.

Demonstration of parsing d attribute with svg.path

So install the code (from and admin rights command console) with...

pip install svg.path

Run Python.exe to get into Python environment and enter the following statements (responses are also shown, and indented)

C:\Users\Simon>python
Python 3.6.3 (v3.6.3:2c5fed8, Oct  3 2017, 18:11:49) [MSC v.1900 64 bit (AMD64)] on win32
Type "help", "copyright", "credits" or "license" for more information.
>>> from svg.path import Path,Line,Arc
>>> from svg.path import parse_path
>>> parse_path('m 241.666,133.557 h 2.364 v -25.886 h -2.364 z')
Path(Line(start=(241.666+133.557j), end=(244.03+133.557j)), 
     Line(start=(244.03+133.557j), end=(244.03+107.671j)), 
     Line(start=(244.03+107.671j), end=(241.666+107.671j)), 
     Line(start=(241.666+107.671j), end=(241.666+133.557j)), closed=True)
>>>

So we can see the path being parsed into a sequence of Line objects each with their own start and end co-ordinate pairs.

Python program to process paths

So now we can write some code to extract the height of the rectangle (which represents the underlying data point).

from lxml import etree
from svg.path import Path,Line
from svg.path import parse_path

sFileName = 'C:/Users/Simon/Downloads/pdf_skunkworks/inflation-report-may-2018-page6.svg'

tree=etree.parse(sFileName)

xpath = r"//svg:path[@style='fill:#19518b;fill-opacity:1;fill-rule:nonzero;stroke:none']"

#print (xpath)
bluePaths = tree.xpath(xpath,namespaces={   'svg': "http://www.w3.org/2000/svg"  })

for bluePath in bluePaths:
    parsed=parse_path (bluePath.attrib['d'])
    secondLine = parsed[1]
    print (secondLine.end.imag - secondLine.start.imag) #outputs the height

Tuesday 19 June 2018

SVG - VBA - Extracting Path Data

So in the last few posts I have been travelling towards a solution that allows code to scrape data from a Bank Of England PDF. I have got so far as to break up the PDF into separate SVG files. SVG files are easier to work with because they are Xml based.

XPath in VBA

So my first language is VBA and I can quickly give some test code to demonstrate the XPath logic before I delve into a Python solution

Sub TestXml()
    '*Tools->References->Microsoft XML, v6.0
    Dim xml As MSXML2.DOMDocument60
    Set xml = New MSXML2.DOMDocument60
    
    xml.setProperty "SelectionNamespaces", "xmlns:svg='http://www.w3.org/2000/svg'"
    xml.Load "C:\Users\Simon\Downloads\pdf_skunkworks\inflation-report-may-2018-page6.svg"
    
    Debug.Assert xml.parseError.ErrorCode = 0
    
    Dim xmlBluePaths As MSXML2.IXMLDOMNodeList
    Set xmlBluePaths = xml.SelectNodes("//svg:path[@style='fill:#19518b;fill-opacity:1;fill-rule:nonzero;stroke:none']")
    
    Debug.Assert xmlBluePaths.Length = 28
    
    Dim xmlRedPaths As MSXML2.IXMLDOMNodeList
    Set xmlRedPaths = xml.SelectNodes("//svg:path[@style='fill:#a80c3d;fill-opacity:1;fill-rule:nonzero;stroke:none']")
    
    Debug.Assert xmlRedPaths.Length = 28
    
    Dim xmlGreyPaths As MSXML2.IXMLDOMNodeList
    Set xmlGreyPaths = xml.SelectNodes("//svg:path[@style='fill:#a98b6e;fill-opacity:1;fill-rule:nonzero;stroke:none']")
    
    Debug.Assert xmlGreyPaths.Length = 28

    Dim xmlElement As MSXML2.IXMLDOMElement
    Set xmlElement = xmlBluePaths.Item(0)
    
    Debug.Print xmlElement.xml
    Debug.Print xmlElement.getAttribute("d")

End Sub

The next problem however is how to parse the path data which can be found in the d attribute of a path element, here is an example of an element...

<path xmlns="http://www.w3.org/2000/svg" id="path670" style="fill:#19518b;fill-opacity:1;fill-rule:nonzero;stroke:none" d="m 241.666,133.557 h 2.364 v -25.886 h -2.364 z"/>

Within that element one can see the path data packed into the d attribute...

m 241.666,133.557 h 2.364 v -25.886 h -2.364 z

So we need code to parse this path data. But I am not going to give that code in VBA, instead I have a Python library to show you, see next post.

Monday 18 June 2018

Python - Split PDF into single page SVG files by shelling Inkscape

So if you have been the last few posts you know I want to get data out of a PDF file (in this case a Bank of England Inflation Report). The python library PyPDF2 is good and will split a pdf into separate pages. No doubt, PyPDF2 will do a ton of other stuff to manipulate pdf files. However, I find the pdf file format is difficult to understand which limits how much I want to use a pdf python library. Instead, I have found that Inkscape converts PDFs to SVGs and that we can automate this on the command line.

This means I am in a position to give the latest version of a program which breaks up a PDF file into separate SVG files for each page. (You'll need Inkscape installed). Here it is...

# with thanks to user26294 at Stack Overflow
# https://stackoverflow.com/questions/490195/split-a-multi-page-pdf-file-into-multiple-pdf-files-with-python#answer-490203

from PyPDF2 import PdfFileWriter, PdfFileReader

def DecryptPdf(pdfFileReader,password):
    if pdfFileReader.isEncrypted:
        try:
            pdfFileReader.decrypt(password)
            print ('File decrypted')
        except Exception as e:
            print ('File decryption failed:' + str(e))
    else:
        print ('File not enrypted')

def SuffixFilename(fileName, suffix):
    import os.path
    filePath = os.path.split(fileName)
    
    filePath2 = filePath[1].split('.')
    return  filePath[0] + '\' +filePath2[0] + suffix + '.' + filePath2[1]


def OutputPage(pdfFileNameSrc,pdfFileNamePage, pageNum):
    pdfFileSrc = open(pdfFileNameSrc, "rb")
    pdfFileReaderSrc = PdfFileReader(pdfFileSrc)
    DecryptPdf(pdfFileReaderSrc,'')
    
    pageOutput = PdfFileWriter()
    pageOutput.addPage(pdfFileReaderSrc.getPage(pageNum))

    with open(pdfFileNamePage, "wb") as outputStream:
        pageOutput.write(outputStream)
        print('written page%s' % pageNum)
        outputStream.close 
    pdfFileSrc.close #tidy up
    

def InkscapePdfToSvg(pdfFileName):
    import subprocess 
    svgFileName=pdfFileName.replace(".pdf",".svg")
    
    completed = subprocess.run(['c:/Progra~1/Inkscape/Inkscape.exe',
            '-z', 
            '-f', pdfFileName , 
            '-l', svgFileName])

    return svgFileName


if __name__ == "__main__": 

    pdfFileNameInflation = "C:\Users\Simon\Downloads\pdf_skunkworks\inflation-report-may-2018.pdf"
    pdfFileInflation = open(pdfFileNameInflation, "rb")

    pdfFileReaderInflation = PdfFileReader(pdfFileInflation)

    DecryptPdf(pdfFileReaderInflation,'')
    pageCount = pdfFileReaderInflation.numPages

    for i in range(pageCount):
        pdfFileNamePage=SuffixFilename(pdfFileNameInflation,"-page%s" % i)
        
        OutputPage(pdfFileNameInflation,pdfFileNamePage,i)
        print (InkscapePdfToSvg(pdfFileNamePage))

Python - Use Process Monitor to diagnose Subprocess.run

Python can shell out and run other executables but sometimes it fails; and it is not always apparent why. In this post I show how Process Monitor (and some help from StackOverflowers) helped me to get the right syntax.

Inkscape converts PDFs to SVG

As part as my ongoing struggles with pdf files I was looking for a better way to get content from PDF files. I had discovered that Inkscape allows the conversion of a single page PDF into an SVG file, (there is a set of instructions here).

I'd prefer SVG files as they are XML and I know how to traverse and navigate them. Indeed, I have blogged about using VBA XML to create an SVG file.

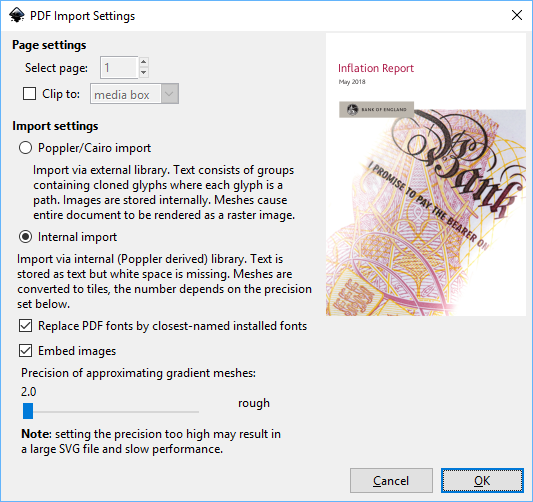
Following the instructions given I get a single dialog box (shown below) and then success. This is great but I wanted to automate the process.

Inkscape's Command Line Options

So I wanted a command line way of getting Inkscape to do the pdf to svg conversion. I found Inkscape installed at C:\PROGRA~1\Inkscape> and queried it for command line options

C:PROGRA~1Inkscape>inkscape --help
Usage: inkscape [OPTIONS...] [FILE...]

Available options:

  -z, --without-gui                          Do not use X server (only process
                                             files from console)
  -f, --file=FILENAME                        Open specified document(s)
                                             (option string may be excluded)
...
  -l, --export-plain-svg=FILENAME            Export document to plain SVG file
                                             (no sodipodi or inkscape
                                             namespaces)
...
Help options:
  -?, --help                                 Show this help message
      --usage                                Display brief usage message

So all the required options are there and we can construct the right command line; the following worked and exported a pdf to svg...

c:\progra~1\Inkscape\inkscape -z -f "N:\pdf_skunkworks\inflation-report-may-2018-page0.pdf" -l "N:\pdf_skunkworks\inflation-report-may-2018-page0.svg

Excel VBA code to shell Inkscape to Convert PDF to SVG

As part of investigations I also wrote some VBA code to execute the above command line...

Sub TestShellToInkscape()
    '* Tools->References->Windows Script Host Object Model (IWshRuntimeLibrary)
    Dim sCmd As String
    sCmd = "c:\progra~1\Inkscape\inkscape -z -f ""N:\pdf_skunkworks\inflation-report-may-2018-page0.pdf"" -l ""N:\pdf_skunkworks\inflation-report-may-2018-page0.svg"""
    Debug.Print sCmd
    
    Dim oWshShell As IWshRuntimeLibrary.WshShell
    Set oWshShell = New IWshRuntimeLibrary.WshShell
    
    Dim lProc As Long
    lProc = oWshShell.Run(sCmd, 0, True)
    
End Sub

Python code to shell Inkscape to Convert PDF to SVG

And here is the final Python code which also shells out to Inkscape and converts pdf to svg.

import subprocess 
completed = subprocess.run(['c:/Progra~1/Inkscape/Inkscape.exe',
        '-z', 
        '-f', r'N:/pdf_skunkworks/inflation-report-may-2018-page0.pdf' , 
        '-l', r'N:/pdf_skunkworks/inflation-report-may-2018-page0.svg'])
print ("stderr:" + str(completed.stderr))
print ("stdout:" + str(completed.stdout))

So this turned out to be the right answer, specifically passing each argument separately (whereas VBA passes whole string).

Diagnosing Subprocess.run

The correct Python code is given above but this blog post is more about the journey to get there.

My early attempts did not work and I resorted to StackOverflow to get help. JacobIRR put me on the right track saying that I could use forward slashes and Python could work out when to swap them for backslashes. I took on board this suggestion but it still didn't quite work.

Another StackOverflower asked if I knew that Inkscape was actually running. I thought this unlikely but sought to provide a screenshot that it was indeed running. Task manager was insufficient for this. So instead I turned to Process Monitor to grab the screenshot.

Using Process Monitor to diagnose Subprocess.run

Taking a process shell tree was quite tricky; it required running the python script and then quick as a flash switching (ALT+TAB) to Process Monitor and then pressing Ctrl+T. Here is the first snap which shows a malfunctioning Python program with its arguments being passed to Inkscape with overzealous slashes!

This second snap is one of correctly working code (see above). You can see how the triple slashes have gone, thankfully. Also not using double quotes helped.

Final Thoughts

So, if you are having difficulty with Subprocess.run do please consider using Process Monitor to help diagnose what actually gets passed as arguments.

Sunday 17 June 2018

PDF - Gripes with PDF file format

So I wanted to extract graphics from a Bank of England report but it turned out to be very involved. I began to get drawn into the PDF file format. Here are some notes on its difficulty.

Firstly, a pdf is massive and as a first step I recommend breaking into single page pdf files. I have written a blog post here which shows how.

Secondly, we need to say that pdf files can be encrypted, the Bank of England report is but with a password of an empty string "" which is a little tedious. Luckily the Python library PyPDF2 can decrypt a file with the following code

def DecryptPdf(pdfFileReader,password):
    if pdfFileReader.isEncrypted:
        try:
            pdfFileReader.decrypt(password)
            print ('File decrypted')
        except Exception as e:
            print ('File decryption failed:' + str(e))
    else:
        print ('File not encrypted')

Thirdly, we have to deal with compression. So even after decrypting the next problem is compression, certain portions of a pdf document will be compressed and so read as gibberish in a text editor. Because of this I had great difficulty scratching the surface of the pdf file format.

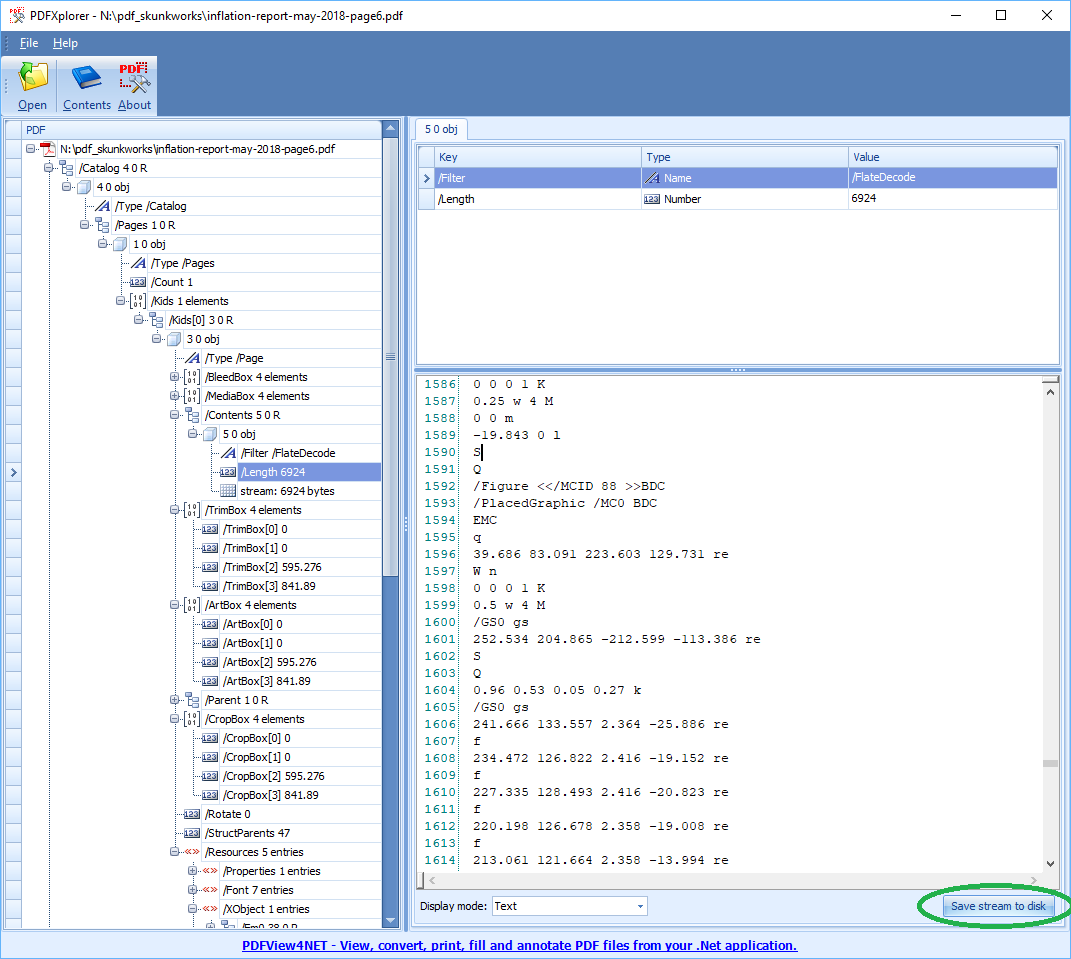
What is needed is a good program that will help you explore the structure and thankfully I found PDFXplorer. Here is a screenshot showing a single page of the report being explored, it shows a compressed stream in decompressed view. Also it has a Save stream to disk button which allows the stream to be exported and then viewable in a text editor.

Fourthly, the pdf file format is unlike any xml, json or other standard file. So after using PDFXplorer to save a stream to disk and examining it in a text editor I found a key section...

/Figure <</MCID 88 >>BDC 
/PlacedGraphic /MC0 BDC 
EMC 
q
39.686 83.091 223.603 129.731 re
W n
0 0 0 1 K
0.5 w 4 M 
/GS0 gs
252.534 204.865 -212.599 -113.386 re
S
Q
0.96 0.53 0.05 0.27 k
/GS0 gs
241.666 133.557 2.364 -25.886 re
f
234.472 126.822 2.416 -19.152 re
f
227.335 128.493 2.416 -20.823 re

So to interpret this language one needs to reference Appendix A of this 756 page document . Here is a table of some of the operators signified by the letters

BDC=Begin marked-contentEMC=End marked-contentq=Save graphics statere=Append rectangle to pathW=Set clipping...
n=End path without filling...K=Set CMYK color for stroking opsw=Set line widthM=Set miter limitgs=Set ... graphics state...
S=Stroke pathQ=Restore graphics statek=Set CMYK color for nonstroking opsf=Fill path using nonzero winding/=start of a name

So the line highlighted in blue 0.96 0.53 0.05 0.27 k caught my eye as I was looking for the path data of some blue rectangles in the following graph. The k operator sets the colour using a CMYK (Cyan Magenta Yellow Key) color code, to convert to RGB see this web site. The lines that follow on from the CMYK line draw rectangles, they are part of this graphic taken from page 6 of a Bank of England report. The first blue rectangle is shown selected with double arrow handles...

So, in my opinion the pdf file format is difficult to work with. I cannot imagine how to begin parsing this document. it is true that there will probably be Python libraries to help but one still needs to browse the document and figure out what are the right questions to ask any such Python library.

In a future post, I'll show how converting the page to an SVG file faciliates navigation, as a preview taster I can show you that the selected blue rectangle gets converted into the following SVG/XML which whilst it maybe verbose is clearly selectable with some XPath...

<path
    id="path5759"
    style="fill:#19518b;fill-opacity:1;fill-rule:nonzero;stroke:none"
    d="m 241.666,133.557 h 2.364 v -25.886 h -2.364 z" />

Final Thoughts

I didn't much like my dive into PDF file formats and I'd like not to revisit them again any time soon. But whether they can be dispensed with depends on one goals and the alternative technologies available.

Python - PDF - Split large file into single pages

So last post I showed how to extract text from a PDF using Python and the PyPDF2 library. My example was a Bank of England report. I wanted next to extract the graphics from the report. This turned out to be non-trivial and requires a number of steps. The first step I'd recommend is to break a large document into single page documents.

Python PDF Splitter

So for reference the test document is at BofE Inflation Report May 2018.

Luckily some code existed on Stack Overflow to break up the pages...

# with thanks to user26294 at Stack Overflow
# https://stackoverflow.com/questions/490195/split-a-multi-page-pdf-file-into-multiple-pdf-files-with-python#answer-490203

from PyPDF2 import PdfFileWriter, PdfFileReader

def DecryptPdf(pdfFileReader,password):
    if pdfFileReader.isEncrypted:
        try:
            pdfFileReader.decrypt(password)
            print ('File decrypted')
        except Exception as e:
            print ('File decryption failed:' + str(e))
    else:
        print ('File not enrypted')

def SuffixFilename(fileName, suffix):
    import os.path
    filePath = os.path.split(fileName)
    
    filePath2 = filePath[1].split('.')
    return  filePath[0] + '\' +filePath2[0] + suffix + '.' + filePath2[1]


def OutputPage(pdfFileNameSrc,pdfFileNamePage, pageNum):
    #print (pdfFileNameSrc)
    #print (pdfFileNamePage)
    pdfFileSrc = open(pdfFileNameSrc, "rb")
    pdfFileReaderSrc = PdfFileReader(pdfFileSrc)
    DecryptPdf(pdfFileReaderSrc,'')
    
    pageOutput = PdfFileWriter()
    pageOutput.addPage(pdfFileReaderSrc.getPage(pageNum))

    with open(pdfFileNamePage, "wb") as outputStream:
        pageOutput.write(outputStream)
        print('written page%s' % pageNum)
    pdfFileSrc.close #tidy up


if __name__ == "__main__": 

    pdfFileNameInflation = "n:\\pdf_skunkworks\\inflation-report-may-2018.pdf"
    pdfFileInflation = open(pdfFileNameInflation, "rb")

    pdfFileReaderInflation = PdfFileReader(pdfFileInflation)

    DecryptPdf(pdfFileReaderInflation,'')

    for i in range(pdfFileReaderInflation.numPages):
        pdfFileNamePage=SuffixFilename(pdfFileNameInflation,"-page%s" % i)
        
        OutputPage(pdfFileNameInflation,pdfFileNamePage,i)

I have triaged the original code given in a StackOverflow answer because it would not behave in a loop. this must have been some file handle tidfyup issue. My (heavy-handed) solution was to re-initialise the PdfFileReader class in OutputPage() for each iteration. I'm sure a better solution exists and if you know better then feel free to comment below.

Now I have single page pdfs, I can move on ...

Saturday 16 June 2018

VBA - Python - Using Python to read text from a PDF

So June 2018 is Python month where I explore the what the Python libraries can bring to an Excel VBA Developer. Here I show a library which opens a pdf and grabs text.

PDF Text Extractor

So the use case is a newly released market sensitive pdf is published by a central bank and market participants want to scan the contents as quickly as possible. But we need to get the text contents out of the pdf file. In the code below I have downloaded a Bank of England Inflation report as a test pdf.

use pip install PyPDF2 to ensure installation of the required PyPDF2 library. Run this Python script once to register it in the registry and then it is invokable from Excel VBA and some sample client code is given below.

# importing required modules
import PyPDF2

class PythonPDFComClass(object):
  
    _reg_clsid_ = "{72BF0D44-56FC-4ADB-B565-1AF16A502F0F}"
    _reg_progid_= 'PythonInVBA.PythonPDFComClass'
    _public_methods_ = ['Initialize','numPages','extractPageText','tidyUp']

    def Initialize(self,pdfFileName):
        
        self.pdfFileName=pdfFileName
        self.pdfFileObj = open(pdfFileName, 'rb')
        self.pdfReader = PyPDF2.PdfFileReader(self.pdfFileObj)
        return str(self.pdfReader)

    def numPages(self):
        return self.pdfReader.numPages

    def extractPageText(self,pageNum):
        # creating a page object
        pageObj = self.pdfReader.getPage(pageNum)
        return pageObj.extractText()

    def tidyUp(self):
        # closing the pdf file object
        self.pdfFileObj.close()

if __name__=='__main__':
    print ("Registering COM server...")
    import win32com.server.register
    win32com.server.register.UseCommandLine(PythonPDFComClass)

And now some sample VBA code...

Option Explicit

Sub TestPythonPDFComClass()

    Dim pdfInflationReport As Object
    Set pdfInflationReport = CreateObject("PythonInVBA.PythonPDFComClass")
    
    Call pdfInflationReport.Initialize("N:\inflation-report-may-2018.pdf")
    
    Debug.Print pdfInflationReport.numPages
    Debug.Print pdfInflationReport.extractPageText(5) '* Page 6, 0-based
    
    Stop
    Dim lPageLoop As Long
    For lPageLoop = 0 To pdfInflationReport.numPages - 1
        Debug.Print pdfInflationReport.extractPageText(lPageLoop) '* 0-based
    Next
    
    pdfInflationReport.tidyUp

End Sub

and the output before the Stop statement reads


 50 
 In˜ation Report May 2018   Monetary Policy Summary   iiperiod has reduced the degree to which it is appropriate for the MPC to accommodate an 
extended period of in˜ation above the target. The Committee™s best collective judgement therefore remains that, were the economy to develop broadly 
in line with the May In˜ation Report projections, an ongoing tightening of monetary policy over the forecast period would be appropriate to return 
in˜ation sustainably to its target at a conventional horizon. As previously, however, that judgement relies on the economic data evolving broadly 
in line with the Committee™s projections. For the majority of members, an increase in Bank Rate was not required at this meeting. All members agree 
that any future increases in Bank Rate are likely to be at a gradual pace and to a limited extent.

So it appears the Python library has a few glitches reading the text, inflation is spelt not with fl but with a "dingbat" character. Other typos needs to be tidied up. A simple VBA.Replace and other VBA string processing could tidy this up easily. In general, if you look at the screenshot below you'll see that it is an accurate extract. Other pages with charts and diagrams are more jumbled.

Tuesday 12 June 2018

VBA - Beep an Octave

A piece of trivia whilst I'm prepping other meatier posts...

PC Beep can change its note

Whilst I get the Python music stack working, a little code to show that the humble console beep can in fact have its note frequency changed. The following beeps from Middle C up through the octave.

Option Explicit

'http://www.devx.com/vb2themax/Tip/18340 Francesca Balena
Private Declare Function BeepAPI Lib "kernel32" Alias "Beep" (ByVal dwFrequency _
    As Long, ByVal dwMilliseconds As Long) As Long
    
Private Const lMiddleC As Long = 257 'https://pages.mtu.edu/~suits/notefreq432.html

Sub Test()
    
    Dim lNoteLoop As Long

    Dim i As Long
    For i = 0 To 12
    
        lNoteLoop = lMiddleC * (2 ^ (i / 12))
    
        BeepAPI lNoteLoop, 500
    Next

End Sub

Are black and white keys cyclically asymmetric?

Also on music trivia, a little program that illustrates that an octave has 7 white keys and 5 black keys and that if one shifts one key at a time down the keyboard (or up, doesn't matter) that the configuration of black and white keys is unique.

Option Explicit

Sub Test()
    '* as per diagram http://www.piano-keyboard-guide.com/wp-content/uploads/2015/05/piano-keyboard_diagram_2.jpg
    Dim sKeys As String
    sKeys = "WBWBWWBWBWBW"
    
    Dim sShiftingKeys As String
    sShiftingKeys = sKeys
    
    Debug.Assert Len(sKeys) = 12


    Dim dic As Scripting.Dictionary
    Set dic = New Scripting.Dictionary
    
    dic.Add sKeys, 0
    
    Dim lLoop As Long
    For lLoop = 1 To 11
        
        sShiftingKeys = Right(sShiftingKeys, 1) & Mid(sShiftingKeys, 1, 11)
        dic.Add sShiftingKeys, 0
    Next

    Debug.Print VBA.Join(dic.Keys, vbNewLine)

End Sub

The above code outputs the following unique set of combinations (I think the uniqueness is driven off 7 and 5 being prime numbers)...

WBWBWWBWBWBW
WWBWBWWBWBWB
BWWBWBWWBWBW
WBWWBWBWWBWB
BWBWWBWBWWBW
WBWBWWBWBWWB
BWBWBWWBWBWW
WBWBWBWWBWBW
WWBWBWBWWBWB
BWWBWBWBWWBW
WBWWBWBWBWWB
BWBWWBWBWBWW

Monday 11 June 2018

Python - VBA - SciPy.CubicSpline - Curve Building

So, it's Python month on the Excel Development Blog where we look at elements of the Python ecosystem and see what they can do for the Excel (VBA) developer. This post I look curve building, that is the ability to take data and draw a curve of best fit crops up in finance rather a lot but specifically two use cases come to mind.

Yield Curve Fitting

The first use case concerns yield curves which are terms structures of interest rates. A yield curve draws a line of best fit through an array of points which are (typically sovereign) bond yields. The curve is then interpolated when a user wants an interest rate which does not coincide when a sovereign bond's due date. Yield curves are very useful they signal the market's view of the macro-economic trajectory; future interest rates, i.e. predictions about interest rates built into the curve can also be extracted.

Eliminating Jaggedness (Stochasticity) in Stock Data

The second use case I have seen is for technical analysis, the study of stock price movements. Stock charts are jagged and this jaggedness does not go away if one drills into a greater level of detail. This is because stock prices are stochastic and actually there is a branch of calculus called stochastic calculus which deals with the jaggedness but typically these techniques are the sole preserve of people with PHDs in Physics.

Don't worry, for technical analysis a cheat is available and that is to use curve building to smooth jagged stock data into a continuous and differentiable function; then local minima and maxima can be found.

The code

First we need to install Numpy and Scipy, so from an admin rights command window...

C:\WINDOWS\system32>pip install numpy
C:\WINDOWS\system32>pip install scipy

The following code is based on answer given to a Stack Overflow question - How to perform cubic spline interpolation in python?. The code quite simply calls into the CubicSpline class to be found in SciPy.

So here is a Python script which uses a COM Gateway class. (Go below for some VBA client code.) Of note, one can see the underlying CubicSpline object being stored as an instance variable by appending to self.

import numpy as np
from scipy.interpolate import CubicSpline

class PythonCubicSpline(object):
    
    _reg_clsid_ = "{F48006B8-42B5-4D89-8D3C-C3C3E5E24C8D}"
    _reg_progid_= 'SciPyInVBA.PythonCubicSpline'
    _public_methods_ = ['Initialize','Interpolate']

    def Initialize(self,x1,y1):
        # calculate natural cubic spline polynomials
        x = np.array(x1)
        y = np.array(y1)
        
        self.baseCubicSpline = CubicSpline(x,y,bc_type='natural')
        return str(self.baseCubicSpline)

    def Interpolate(self,x):
        return self.baseCubicSpline(x).tolist()

if __name__=='__main__':
    print ("Registering COM server...")
    import win32com.server.register
    win32com.server.register.UseCommandLine(PythonCubicSpline)

<UPDATE>You can make Python COM Gateway classes New-able and capable of early binding in this latest post</UPDATE>

Here is VBA client code which creates the object late bound, passes some bi-variate data into the Initialize method, the work to spline the curve is done there. Subsequent calls show the spline being interrogated; usefully one can supply a single value for interpolation or a list of values for interpolation by passing in an Array().

Option Explicit

Sub TestPythonCubicSpline()

    Dim cubSpline As Object
    Set cubSpline = CreateObject("SciPyInVBA.PythonCubicSpline")
    
    Call cubSpline.Initialize(Array(0, 1, 2, 3, 4, 5), Array(12, 14, 22, 39, 58, 77))
    
    Debug.Print cubSpline.Interpolate(1.25) '* passing single,  outputs 15.203125 
    
    Debug.Print Join(cubSpline.Interpolate(Array(1.25, 1.5)), ";") '# passing an array, outputs 15.203125;16.875

End Sub

Final Thoughts

As a VBA developer you maybe asked to write code to spline a yield curve and you maybe tempted to write VBA code to do this. I suggest you don't, I suggest you use a Python library instead using the gateway class method above. Splining yield curves is a major branch of quantitative analysis and I could not hope to introduce the topic here thoroughly but rest assured there is very probably some free Python code out there that will do what you want so no real need to write your own VBA.

UPDATE

You can make Python COM Gateway classes New-able and capable of early binding in this latest post

Links

Friday 8 June 2018

Python - Javascript - MutationObserver- Chrome Extension - ClockWatch

So in the previous post I gave code to detect changes in a web page and POST those changes to a Python based web server which in turn writes the payload to a folder, i.e. an HTTP based message queue. But that code was embedded in the same page as that which changed and was unrealistic. Much better if we can write a Chrome extension to sit in the browser and observe changes on other web pages. That is what we do here on this blog post.

Legal Note

Do please get permission before you start web scraping otherwise you fall foul of the law. There are legitimate use cases for this technology: imagine you are at a large company with plenty of IT teams, you've asked for a data feed but other team say you are not a priority but say feel free to web scrape.

Minimal Chrome Extension

The bare minimum to get a Chrome Extension working is one folder containing two files, that's all. The folder can be named anything. The two files are (i) content.js and (ii) manifest.json.

manifest.json

Here is an example manifest.json file

  {
    "name": "Clock Watch",
    "version": "0.1",
    "description": "example of a Mutation Observer",
    "permissions": [],
    "content_scripts": [ {
      "js": [ "content.js" ],
      "matches": [ "http://exceldevelopmentplatform.blogspot.com/2018/06/javascript-dynamic-blog-clock.html"   ] }
    ],
    "manifest_version": 2
  }

So much of the manifest is boilerplate but one thing to note of interest in the matches array which tells what pages to run extension over. I have published the clock code to a separate blog post, http://exceldevelopmentplatform.blogspot.com/2018/06/javascript-dynamic-blog-clock.html and we'll use that as a laboratory test page. In the matches array one can give a selection of pages, here we only have one.

content.js

This is the content.js file with the code pretty much unchanged from the previous post; all that is added is an IIFE (Immediately Invoked Function Expression) which serves as an entry point, i.e. code that runs first. Also, we have a try catch block around our MutationObserver code to help debugging.

~function () {
  'use strict';
  console.log("clock watch iife running");
  setTimeout(startObserving,1000);
  
}();

function startObserving() {
  'use strict';
  
  try {
   
        console.log("entering startObserving");
        var MutationObserver = window.MutationObserver || window.WebKitMutationObserver || window.MozMutationObserver;
        if (MutationObserver == null)
            console.log("MutationObserver not available");

        // mutation observer code from https://developer.mozilla.org/en-US/docs/Web/API/MutationObserver
        var targetNode = document.getElementById('clock');

        // Options for the observer (which mutations to observe)
        var config = { attributes: true, childList: true };

        // Callback function to execute when mutations are observed
        var callback = function (mutationsList) {

            for (var mutation of mutationsList) {
                //debugger;
                //console.log(mutation);  //uncomment to see the full MutationRecord
                var shorterMutationRecord = "{ target: div#clock, newData: " + mutation.addedNodes[0].data + " }"

                console.log(shorterMutationRecord);

                var xhr = new XMLHttpRequest();
                xhr.open("POST", "http://127.0.0.1:8000");
                //xhr.setRequestHeader("Content-type", "application/x-www-form-urlencoded");
                xhr.send(shorterMutationRecord);

            }
        };

        // Create an observer instance linked to the callback function
        var observer = new MutationObserver(callback);

        // Start observing the target node for configured mutations
        observer.observe(targetNode, config);

        // Later, you can stop observing
        //observer.disconnect();   
  }
  catch(err) {
   console.log("err.message: "+ err.message);
  }
}

Installing the Extension

In the Chrome browser navigate to chrome://extensions/. Click on "Load Unpacked" and navigate to the folder containing your two files. In my case N:\Clock Watch Chrome Extension\. Then your extension is loaded and should appear.

You can go look at the details page if you want but we are pretty much done. All you need do now is to navigate to the clock page. You'll know if you extension is loaded because a new icon appears in the top right of the Chrome browser window, on the toolbar. In the absence of a given icon, Chrome will take the first letter of your extension and use that as an icon, so below ringed in green in the "C" icon, hover over that and it will read "Clock Watch". Click on the icon and one can remove from menu if you want.

Screenshots- The Clock and the Message Queue

As highlighted in the previous post we have some code which runs a Python web server, taking HTTP POST calls and writing the payloads to a folder. Here is a screenshot to show that working

Final Thoughts

So what have we achieved here? We have a Chrome Extension which observes a page and reports the changes to a message queue by calling out with XmlHttpRequest to a Python web server. Cool but do please use responsibly.

Links

Javascript - Dynamic Blog - Clock

This page is just to host a clock. This is part of an Chrome Extension blog post to be published soon. This page demonstrates that blogspot can run javascript code making pages more dynamic.

14:27:34

The code to make this clock tick is to be found in a <script> tag....

    <script>
        ~function () {
            'use strict';
            startTime();
  
        }();


        function startTime() {
            var today = new Date();
            var h = today.getHours();
            var m = today.getMinutes();
            var s = today.getSeconds();
            m = padZero(m);
            s = padZero(s);
            document.getElementById('clock').innerHTML =
                h + ":" + m + ":" + s;
            var t = setTimeout(startTime, 1000);
        }
        function padZero(i) {
            if (i < 10) { i = "0" + i };  // add zero in front of numbers < 10
            return i;
        }
    </script>